
Using Geographic Location-Based Public Health Features in Survival Analysis
This repository contains the code and data for the paper titled "Using Geographic Location-Based Public Health Features in Survival Analysis" by Navid Seidi, Ardhendu Tripathy, and Sajal Das[1].
Abstract
Time elapsed till an event of interest is often modeled using the survival analysis methodology, which estimates a survival score based on the input features. There is a resurgence of interest in developing more accurate prediction models for time-to-event prediction in personalized healthcare using modern tools such as neural networks. Higher quality features and more frequent observations improve the predictions for a patient, however, the impact of including a patient's geographic location-based public health statistics on individual predictions has not been studied. This paper proposes a complementary improvement to survival analysis models by incorporating public health statistics in the input features. We show that including geographic location-based public health information results in a statistically significant improvement in the concordance index evaluated on the Surveillance, Epidemiology, and End Results (SEER) dataset containing nationwide cancer incidence data. The improvement holds for both the standard Cox proportional hazards model and the state-of-the-art Deep Survival Machines model. Our results indicate the utility of geographic location-based public health features in survival analysis.
What is Survival Analysis?
The term "Survival Analysis" refers to a statistical methodology for the analysis of data, in which the outcome variable of interest is the probability of an Event occurring in each Time frame. By Time, we mean years, months, weeks, or days from the beginning of the follow-up of an individual until one of the desired events. Alternatively, time can refer to the age of an individual when an event occurs. Furthermore, by Event, we mean any change in the health status of an individual. This could be defined as disease incidence, relapse from remission, recovery (e.g., return to work), death, or any designated experience of interest that may happen to an individual [2].
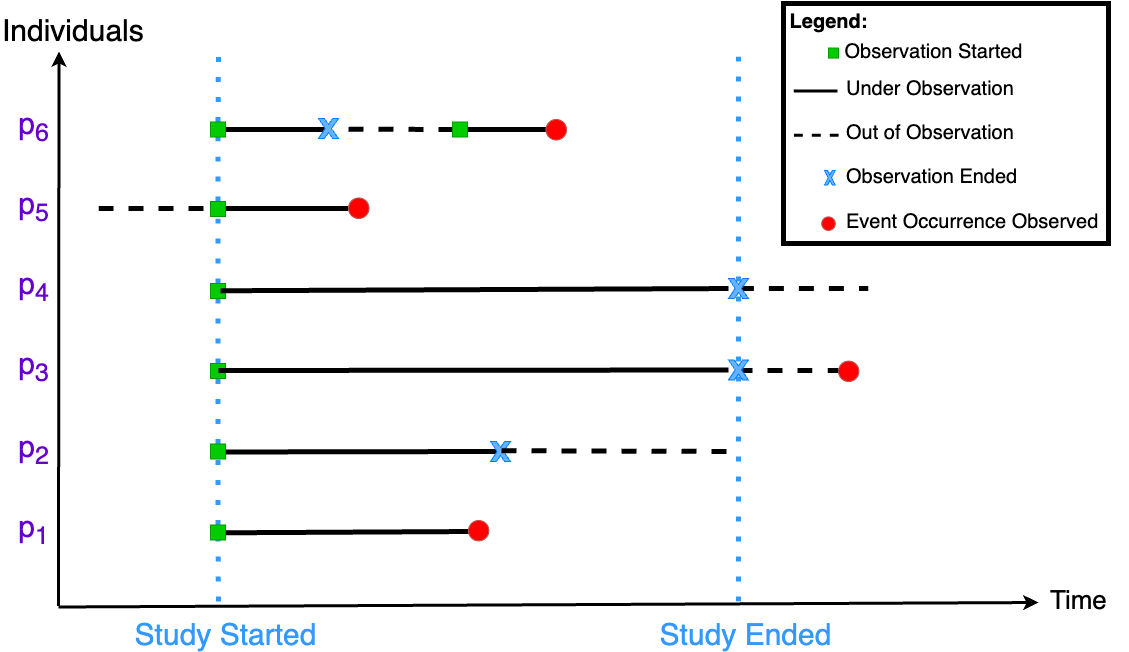
This type of problem is distinct from a standard regression due to the censoring of event times. Censoring happens when we have some knowledge about an individual's survival period but do not know the precise survival time. As illustrated in Fig. 1, there are three types of censored data in any survival analysis study.
- Right-censored: The event did not occur during the study, or the actual event time is equal to or greater than the observed survival time (p2, p3 and p4 in Fig. 1).
- Left-censored: In some cases, "true survival time is less than or equal to the observed survival time" [2]. It indicates that a person who is left-censored at time t has experienced an event between the beginning of time (time 0) and time t, but the exact timing of the event is unknown. In Fig. 1 the event has been observed for p5, but the accurate time is not clear. The only known fact is that the event time is less than the time of ending the study.
- Interval-censored: p6 in Fig. 1 has left the study sometime before the ending time and rejoined it again. Thus, it is impossible to make a comprehensive observation, and the actual event time is within a given time interval.
For the analysis, we start by describing the Survival Function; the probability that a person will outlive a given period represented by S(t) as stated in equation (1). Moreover, equation (2) shows the Hazard Function, λ(t), which is the instantaneous probability per unit of the time that the event will occur:
Equation 1: $$S(t) = Pr(T>t)$$
Equation 2:
λ(t) = lim(δ → 0) [Pr(t ≤ T < t + δ | T ≥ t) / δ]
Given that a person has survived up to time t, the hazard function is the probability that they will not survive an additional tiny period of time, δ. It indicates that those with a higher hazard value are at a greater risk of experiencing the event.
It is possible to construct these functions based on the most recent information regarding event occurrences, the event time for each individual in the datasets, and the related attributes associated with each unique patient. The above features are referred to as covariates and can be either Categorical or Numerical.
Although the survival function is theoretically a smooth curve, it is most commonly approximated using the Kaplan–Meier (K.M.) curve[3] because of its simplicity. The Kaplan-Meier curve is a non-parametric method used to estimate the survival probability of a population over time based on censored data. It is commonly used to illustrate the estimated survival probability over time for a population or group of individuals. Kaplan–Meier curve is the most effective model whenever the covariate is categorical (e.g., medication vs. placebo) or when the covariate takes a small number of values (e.g., drug dosages 0, 20, 50, and 100 mg/day) that may be considered categorical. The K.M. curve is not as practical when dealing with quantitative factors such as gene expression, white blood cell count, or age. Cox proportional hazards regression analysis is an alternate approach when dealing with quantitative predictor variables. Moreover, the CoxPH model may be used with categorical predictor variables, which can be represented as dummy variables or as a binary indicator (0,1).
Let xi denote the vector features for individual i in the dataset. The hazard function for the Cox proportional hazards model is:
Equation 3:
λ(t) = λ0(t) exp(βT xi)
where λ0(t) is defined as the baseline hazard function. β is a vector in the same dimension with xi. The Cox model may be modified if there is a reason to anticipate that the baseline hazard follows a certain shape. In this instance, the baseline hazard λ0(t) is substituted with a provided function. For example, if the baseline hazard function is a Weibull function of time, then it results in the 'Weibull proportional hazard model'[4][5].
Code
The code directory contains the Python code used to generate the results in the paper.
StateESR
The following code contains the code for calculating StateESR.
Click here to download the file.CoxPH Model
The following code contains the code for implementing CoxPH Model on datasets.
Click here to download the file.DSM Model
The following code contains the code for implementing Deep Survival Machines (DSM) Model on datasets.
Click here to download the file.t-Test
The following code contains the code for splitting each dataset into 30 sub-datasets and calculating p-value.
Click here to download the file.Citation
This project has been published in IEEE/ACM CHASE'23. The following is the citation:
References
- N. Seidi, A. Tripathy and S. Das, "Using Geographic Location-based Public Health Features in Survival Analysis," in 2023 IEEE/ACM Conference on Connected Health: Applications, Systems and Engineering Technologies (CHASE), Orlando, FL, USA, 2023 pp. 80-91. doi: 10.1145/3580252.3586972
- Kleinbaum, David G., and Mitchel Klein. Survival analysis a self-learning text. Springer, 1996.
- Kaplan, E. L., and Paul Meier. “Nonparametric Estimation from Incomplete Observations.” Journal of the American Statistical Association 53, no. 282 (1958): 457–81. https://doi.org/10.2307/2281868.
- Barrett, James. "Weibull-Cox proportional hazard model." Institute of Mathmatical and Molecular Biomedicine (2014): 1-7.
- Kumar, Dhananjay, and Bengt Klefsjö. "Proportional hazards model: a review." Reliability Engineering & System Safety 44, no. 2 (1994): 177-188.